Hi, I'am
Navya Vincent
Kuttukaran
I' am a Data Analyst

About

I'am Navya
I’m a Data Analyst who loves transforming raw data into meaningful insights that drive real impact. With skills in Python, SQL and Excel, I regularly collect, clean, and validate data to ensure accuracy and consistency.
I have created automated dashboards and reports in Power BI, Tableau and PowerPoint and also building pipelines and ETL workflows Azure Data Factory, AWS Athena, Snowflake, and Alteryx. I focus on clarity, accuracy, and creating solutions that help teams make better decisions.
Work Experience
Data Analyst
NEI Investments
May 2025 - Current
I work in the investment and fund analytics division, where I build data solutions and provide analytical insights to support the Investment, Risk, and Compliance teams. My responsibilities include collecting, cleaning, and analyzing data related to fund performance, investment and client transactions. I use Python and SQL to merge and validate data from multiple internal and external sources, ensuring accuracy and consistency.
I also create interactive Power BI dashboards that track key financial KPIs such as CRM, fund performance trends, and advisor behavior. In addition to reporting, I design and optimize ETL pipelines using Azure Data Factory. These pipelines automate the ingestion and transformation of data from sources such as market feeds and fund administration systems, improving efficiency and reducing manual data handling.
Data Analyst
Bajaj Allianz General insurance
Aug 2021 - Mar 2025
I work in a fraud analytics team where I analyze team performance and produce data reports on a weekly, monthly, and quarterly basis using Excel, Python, and Alteryx. My role involves performing programming and quantitative analysis by accessing, integrating, and reconciling data from various sources using SQL queries in SAP BI and Snowflake to fulfill client data requests.
I review insurance claims data to identify irregularities or potential fraud using statistical methods and data mining techniques. I also automate processes and enhance dashboard efficiency with Alteryx and Python, maintain KPIs and vendor grading metrics to assess performance, and create interactive dashboards and professional reports using Tableau, Qlik Sense, and PowerPoint. This work has helped uncover trends and deliver actionable insights that support better decision-making across departments.
Projects


Skills










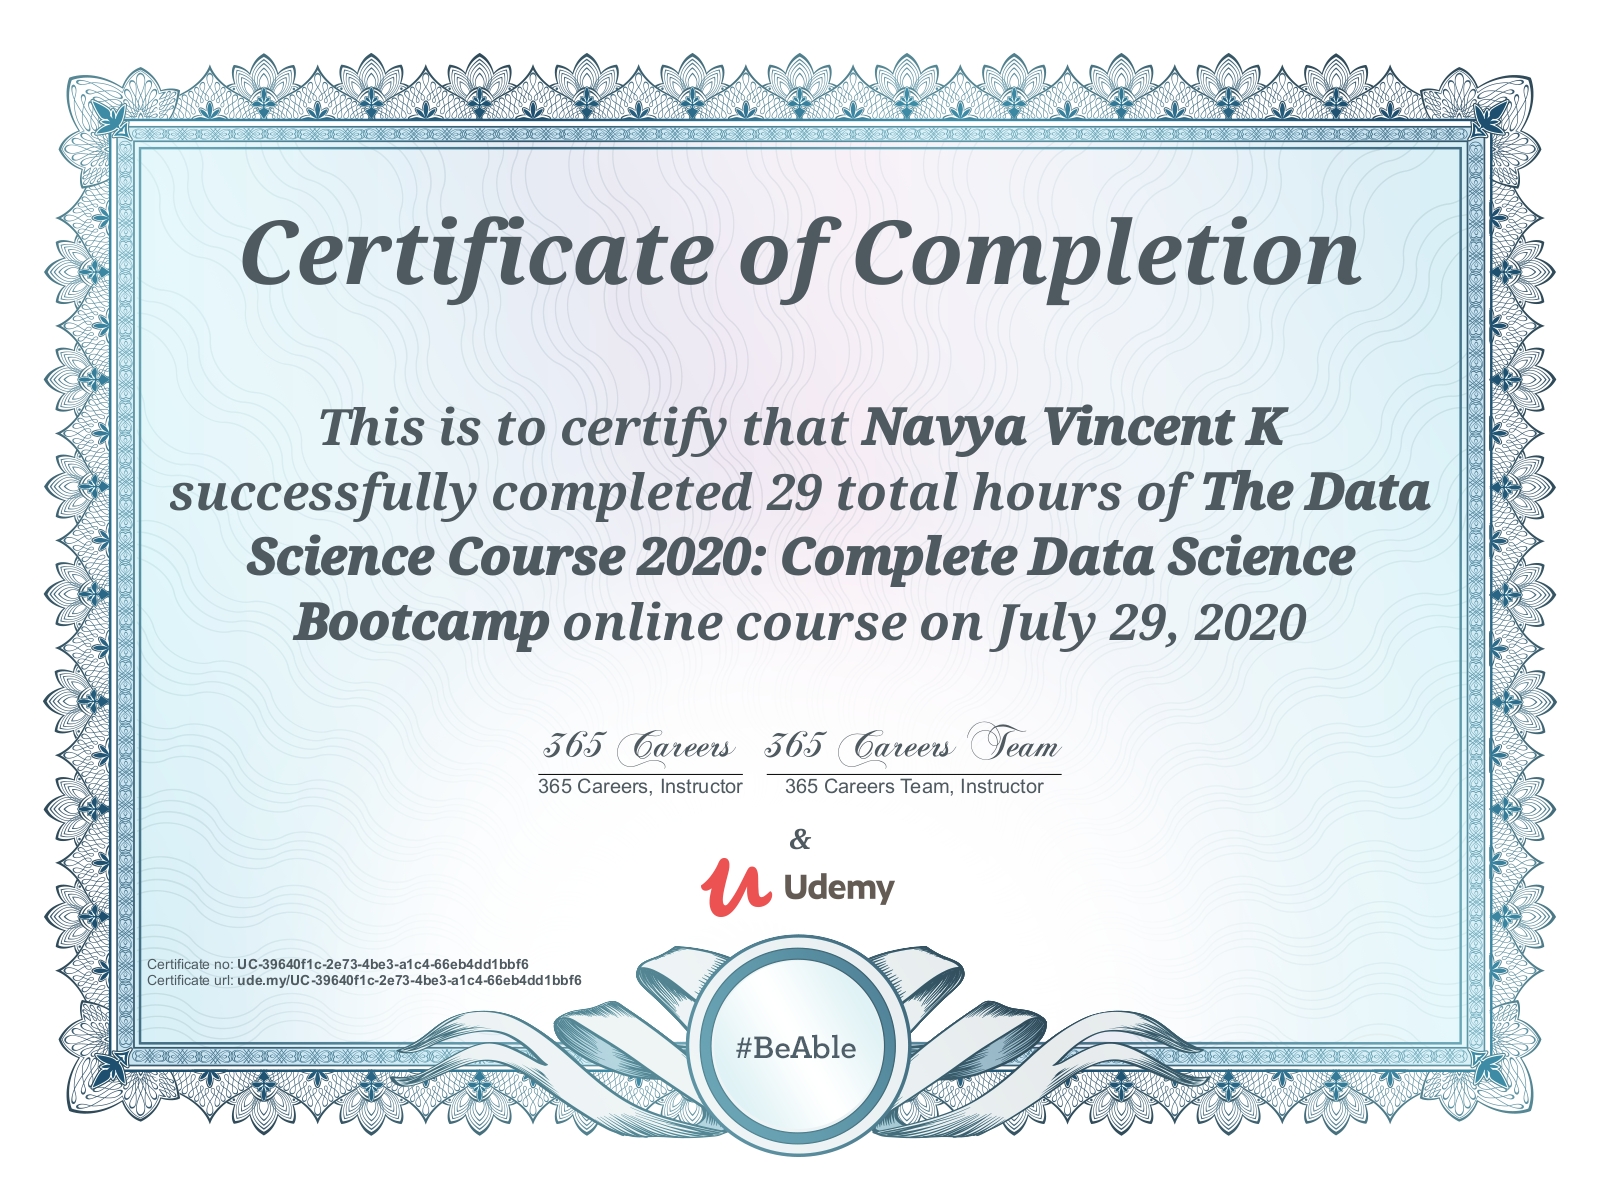
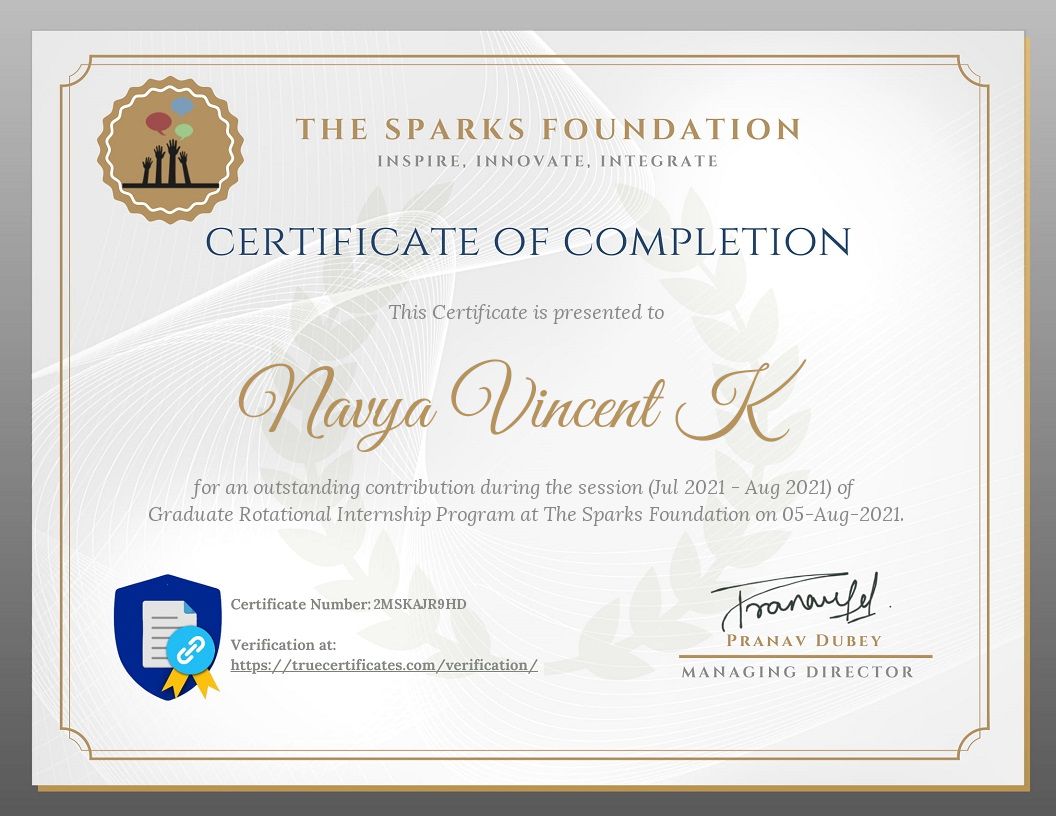
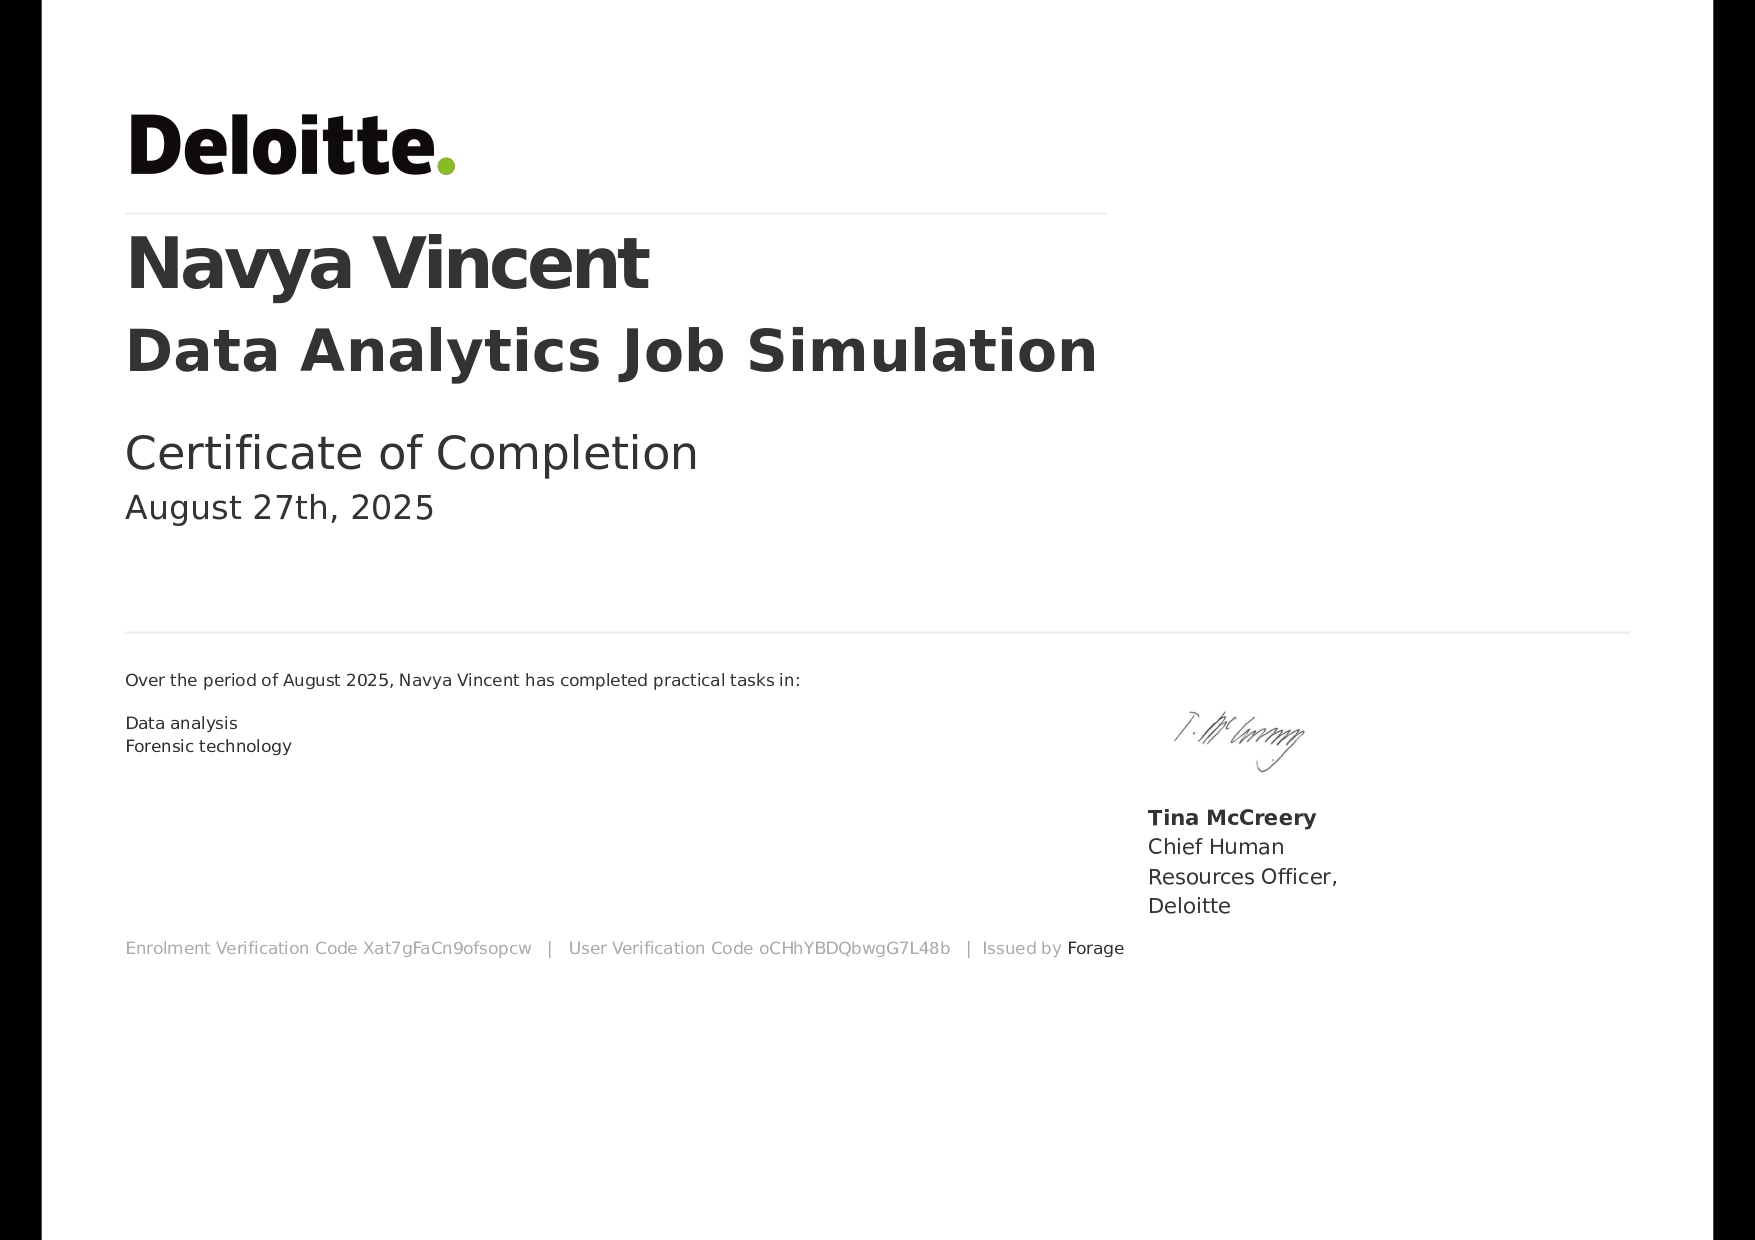
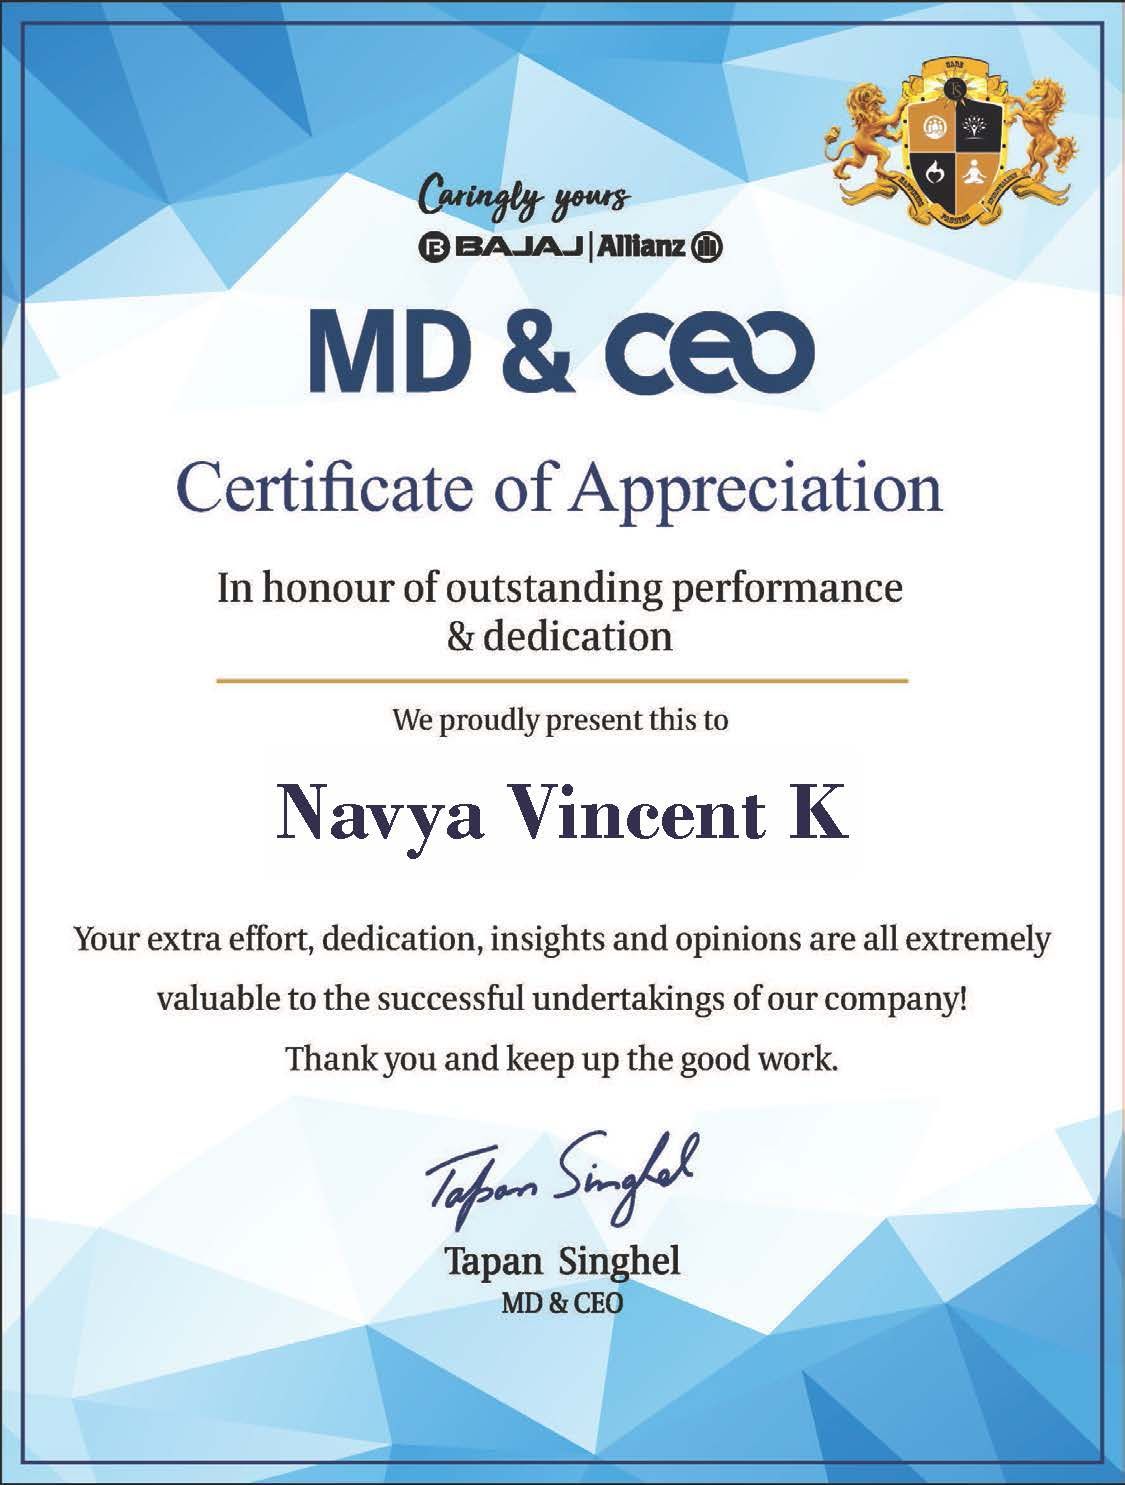
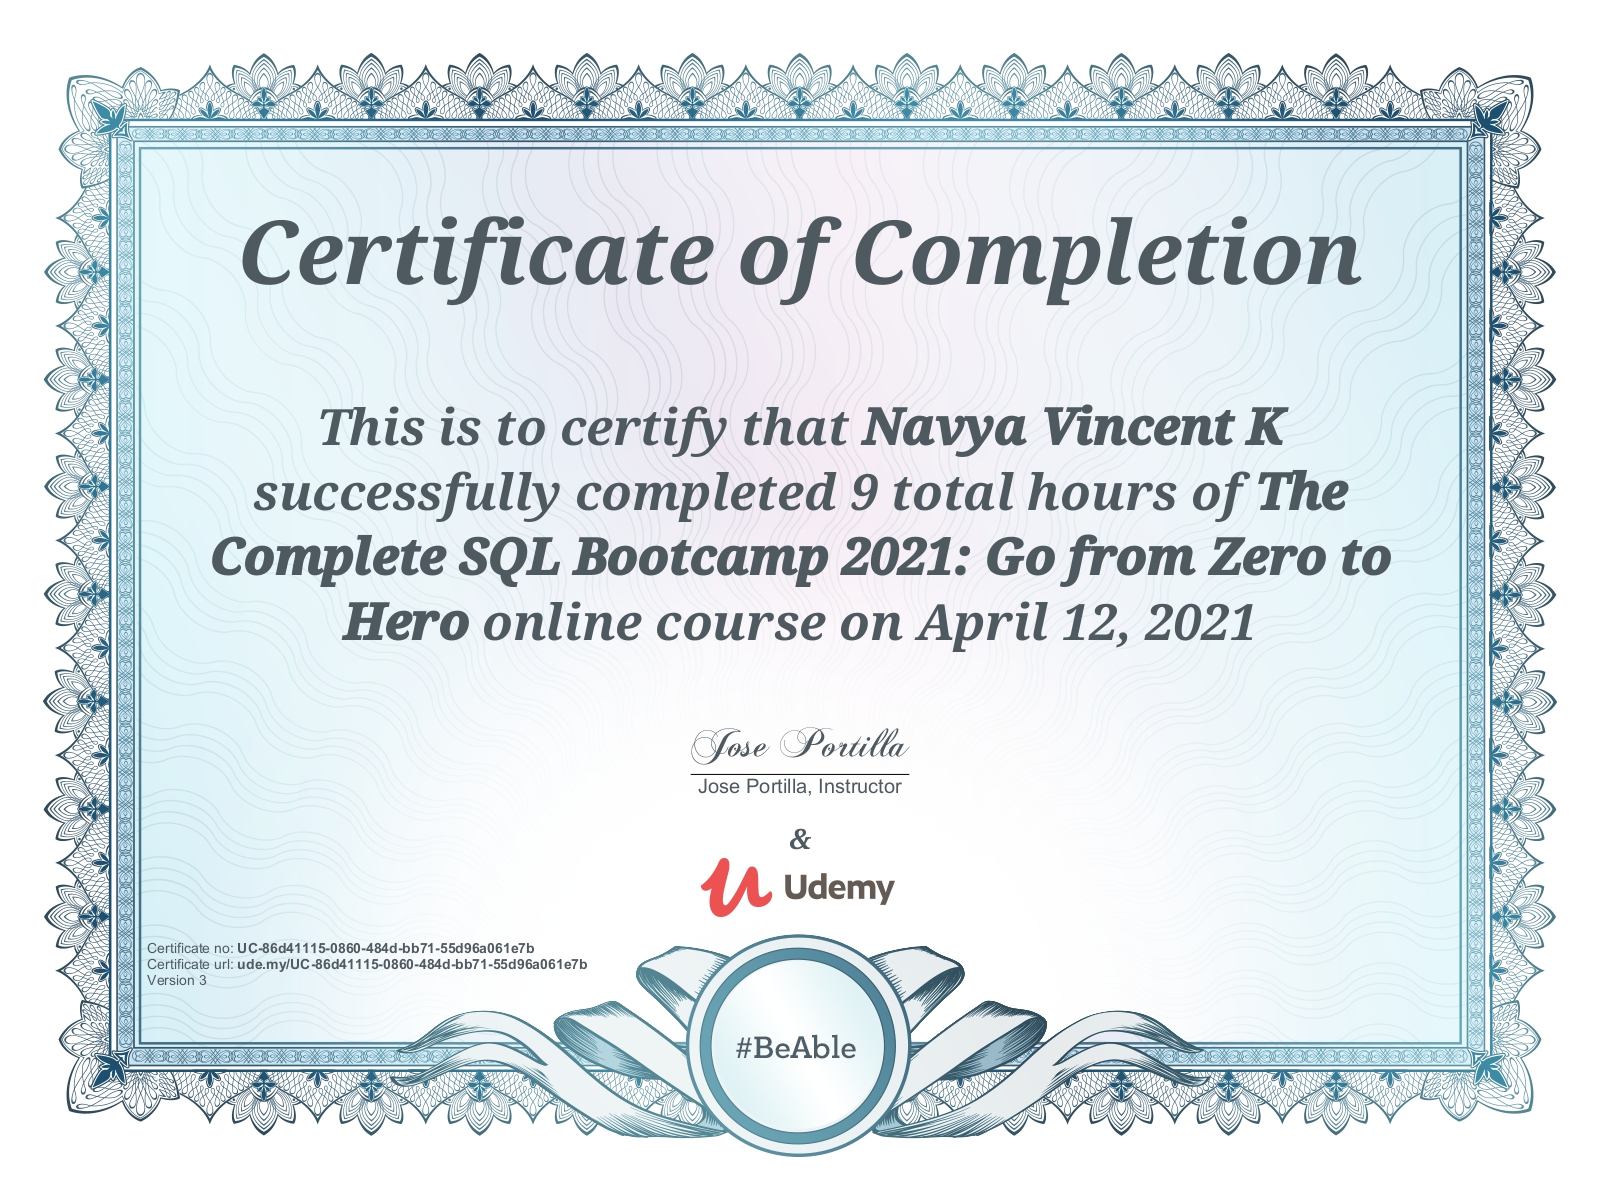
Certificates